Management Units Evolution
Evolution of client, portfolio ans each management units
Management units selection
Select management units with selection boxes
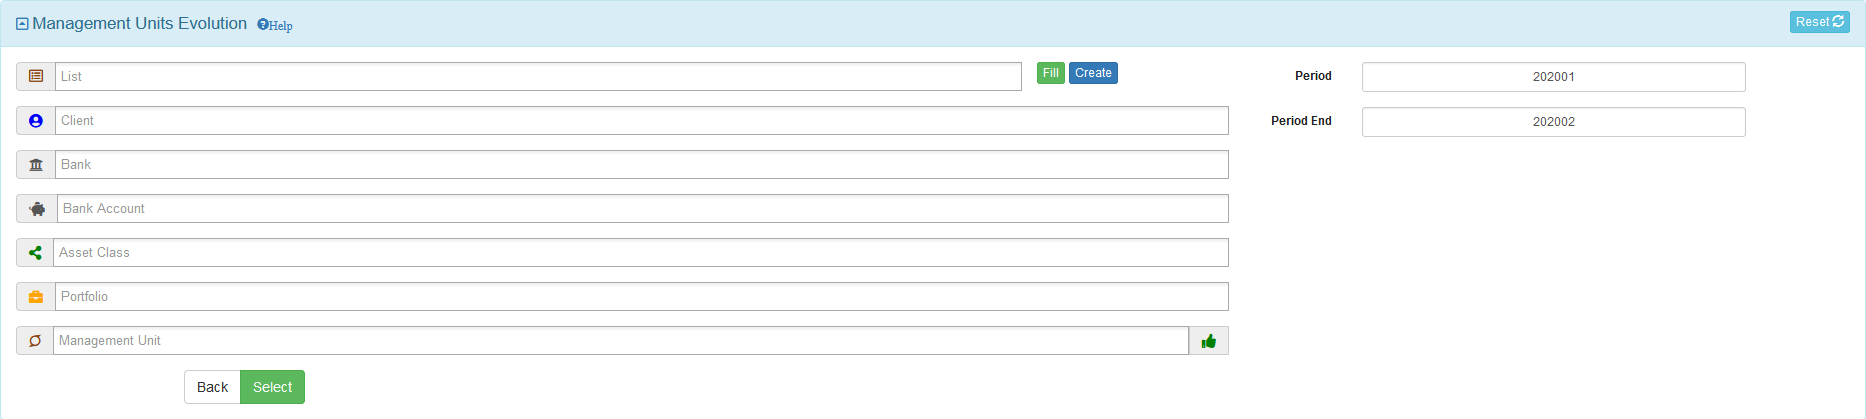
Date selection
By default the management units evolution is calculated from year start until today
Enter a valid historical booking period (YYYYMM format) in Period and Period End boxes to obtain an evolution calculation between 2 periods
![]()
![]()
The selection can be filtered by terms entered in the search box
![]()
Detailed view
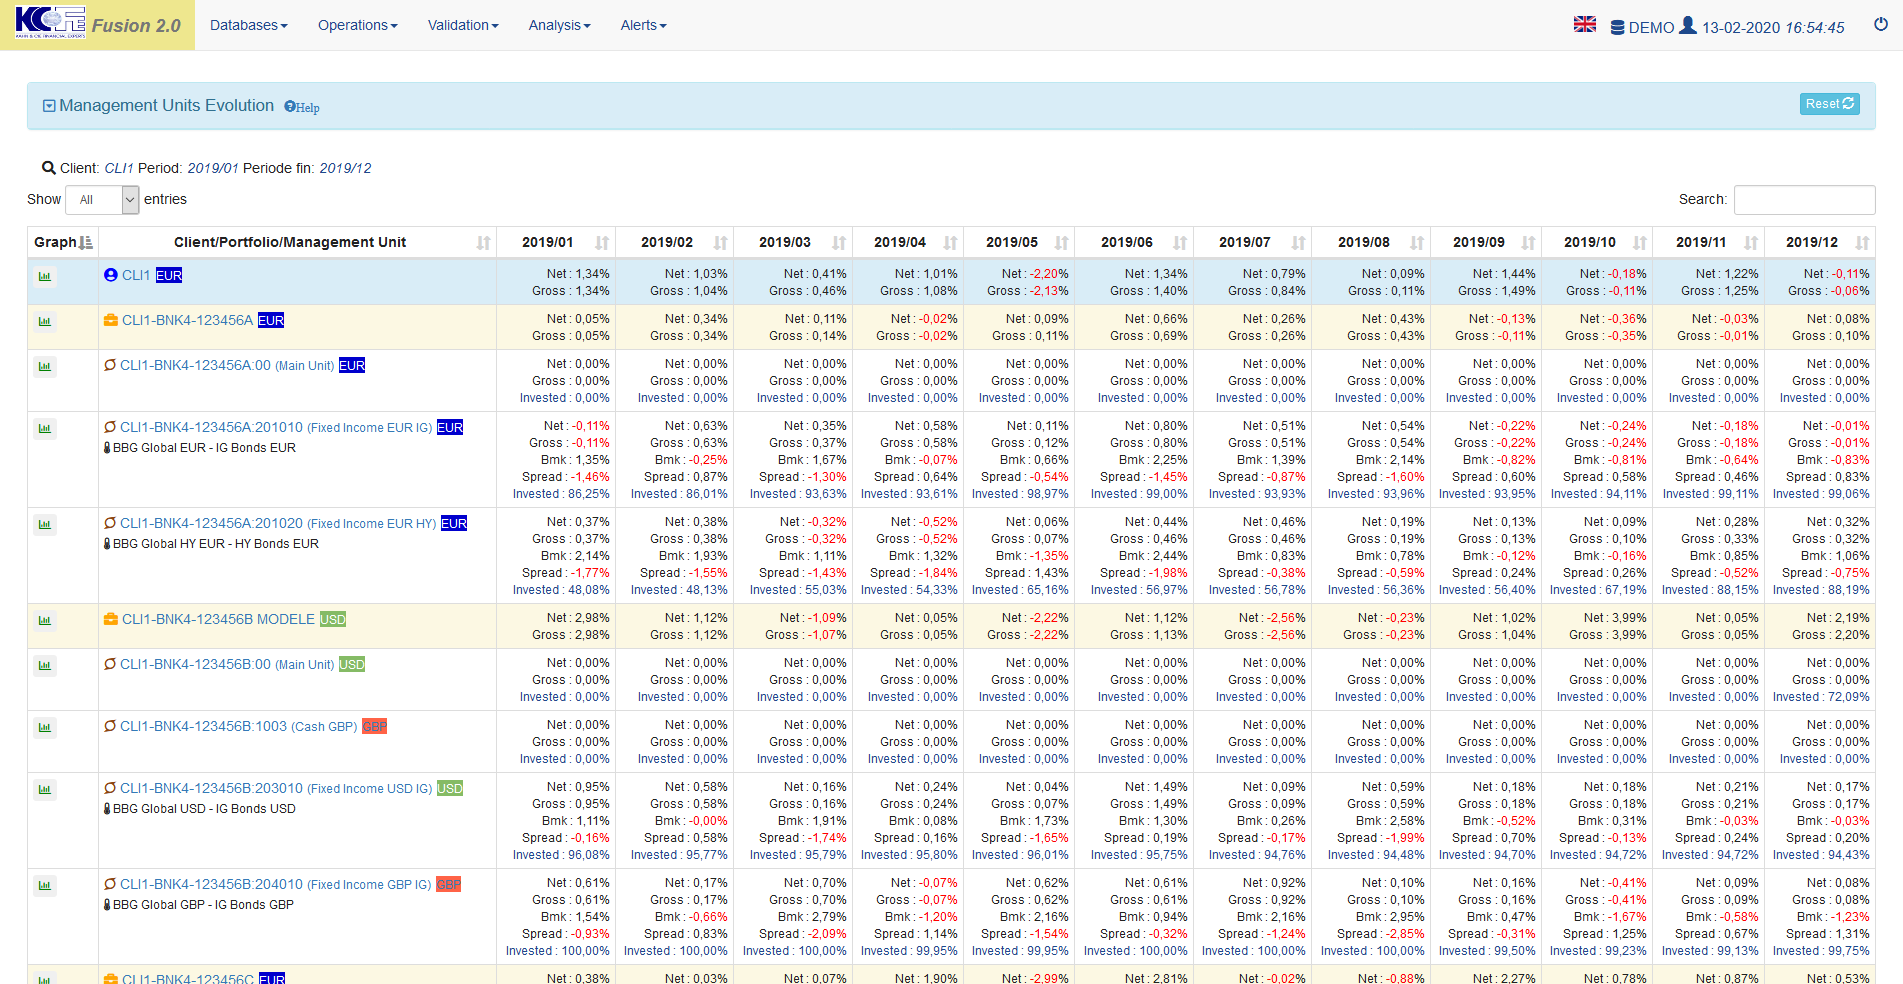
Data table
- Client/Portfolio/Management Unit = yield consolidation level, either client, portfolio or management unit
For each period :
- Net = net yield in consolidation level currency
- Gross = gross yield, not taking into account bank fees and taxes, in consolidation level currency
- Bmk = benchmark yield, in consolidation level currency
- Spread = spread between benchmark yield and gross yield in consolidation level currency
- Invested = percentage invested (excluding cash) of the management unit
Evolution Chart
For each consolidation level, the data can be displayed in a chart with the button ![]()

Chart information
- Blue curve = net change in base 100 (left scale), according to the net yield achieved
- Purple curve = net change in base 100 (left scale), according to the gross yield achieved
- Red curve = benchmark net change in base 100 (left scale), according to the benchmark yield achieved
- Green histogram = percentage invested (right scale)